

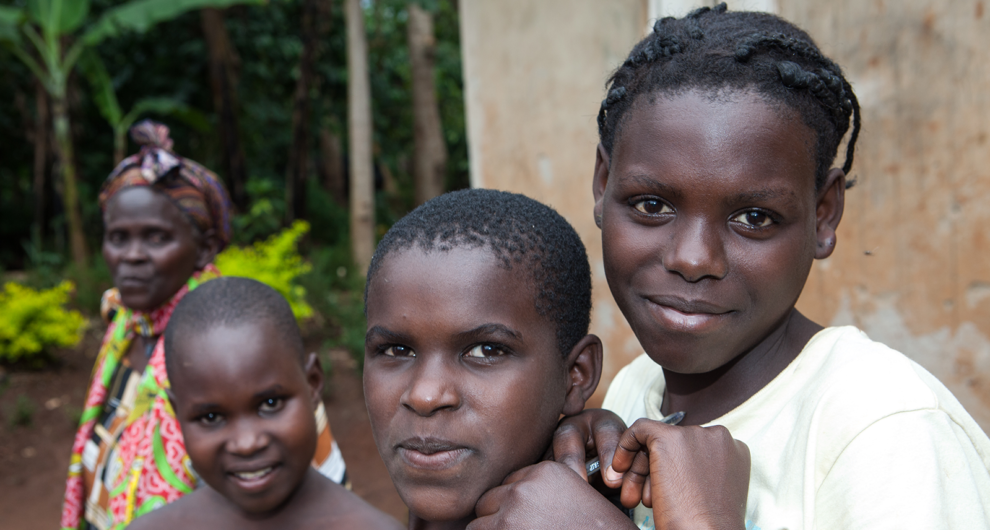
Uganda


AFIDEP has implemented the following projects in Uganda:
- The Demographic Dividend
- Regional Analysis of Youth Demographics
- The Evidence Leaders in Africa (ELA) project
- African Research Collaboration on Sepsis (ARCS)
- Partnership for Increasing the Impact of Vector Control (PIIVeC)
- Drivers of Antimicrobial Resistance in Uganda and Malawi
Research Reports:
- Harnessing the Demographic Dividend Uganda
- East African Regional Analysis of Youth Demographics East African Regional Analysis of Youth Demographics
Research Briefs:
- Regional Analysis of Youth Demographics – East African Community countries
- Regional Analysis of Youth Demographics – Uganda
- Making The Dividend Count Bridging Research And Africa’s Policy Processes
Policy Briefs:
AFIDEP led various stakeholders to develop Uganda’s demographic dividend (DD) roadmap, a process that turned the President, who was previously opposed to family planning(FP) interventions, into an FP champion.
« In order for [our] big population to be advantageous like in India, China and Brazil, we [also] need to invest in education, health, infrastructure development and job creation. That is why I am happy that the issue [on family planning] is now being looked at from the Demographic Dividend perspective…,” he emphasized. “…If all [we] do is control the population and reduce fertility without looking at the other factors, [we] won’t go far as a country, » President H.E. Yoweri Museveni
The President said this while launching the country’s DD report: ‘Harnessing the Demographic Dividend: Accelerating Socioeconomic Transformation in Uganda.’ The report was commissioned by Uganda’s National Planning Authority (NPA), and developed by various stakeholders led by AFIDEP.
Key Details
Population Indicators
Economic development
Health and well-being
Education and skills development
Environment and Climate
Sources:World Bank Reports (WB)UNDP Human Development Reports 2019 (HDR)Population Reference Bureau World Population Datasheet 2019 (PRB) |